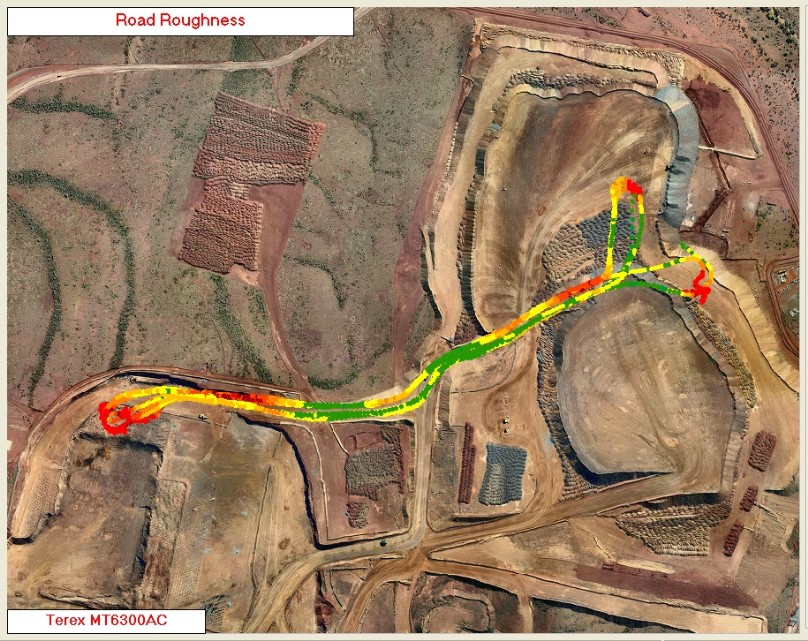
PSD - RCM Analysis
Main menu:
PSD
Power Spectral Density display.
This is the main display of the processed RCM data.
It displays the road roughness based on accelerometer
data recorded at 100 hertz.

Home | PSD | Velocity | Gradient | Resistance | Power | Fuel Use | Ideal Fuel Use | Fuel Difference | Total Energy | Bumps | General Site Map